Welcome to our latest product blog. In this post we explore the different ways in which SwifTest users can view the results of their tests.
When we are in the testing space, documentation is always going to be an area of concern. Keeping accurate records of your test methodology, and the results, can sometimes be a bit of a hassle. But it doesn’t have to be. Here at DWS we like to build solutions that are easy to use, which is why our Dimension products feature multiple ways to view the outcome of your tests. Maintaining an accurate execution history provides many benefits, and is particularly useful when it comes to troubleshooting and reporting.
Troubleshooting
When a test fails, it is important to be able to view where the test has failed. In the example below we have executed a test directly from the test screen. To be able to view the execution history of any test, navigate to the test you want to explore and select the arrow to extend the execution history.
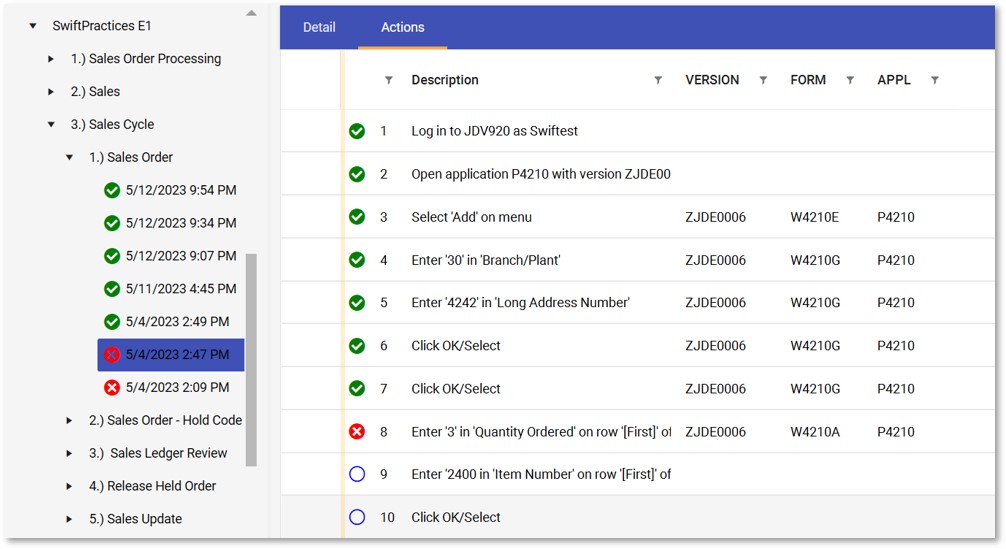
As we can see from the screenshot, there is a timestamp of when each test ran. When you click on the failed test execution and navigate to the tab, this section will indicate on which action the test failed. From here you will be able to start troubleshooting as to why your test has failed.
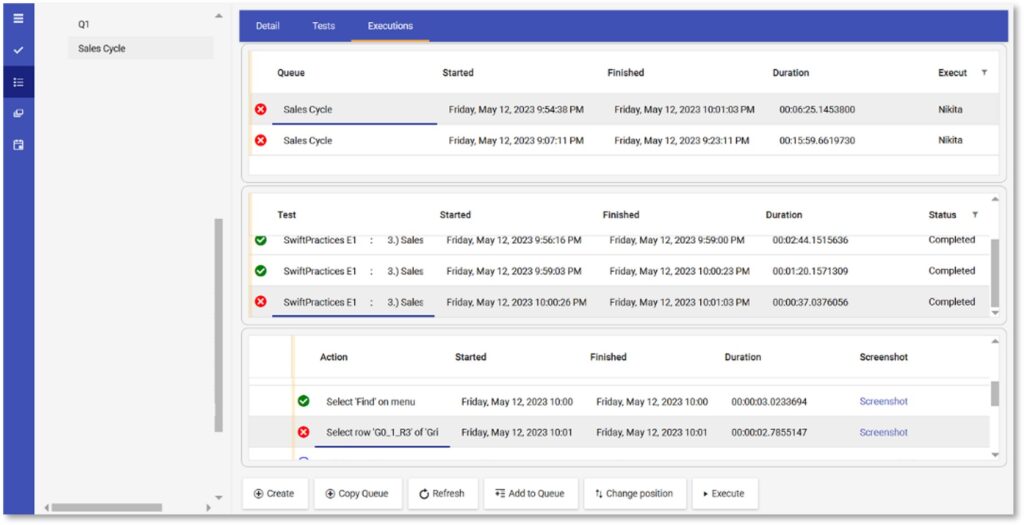
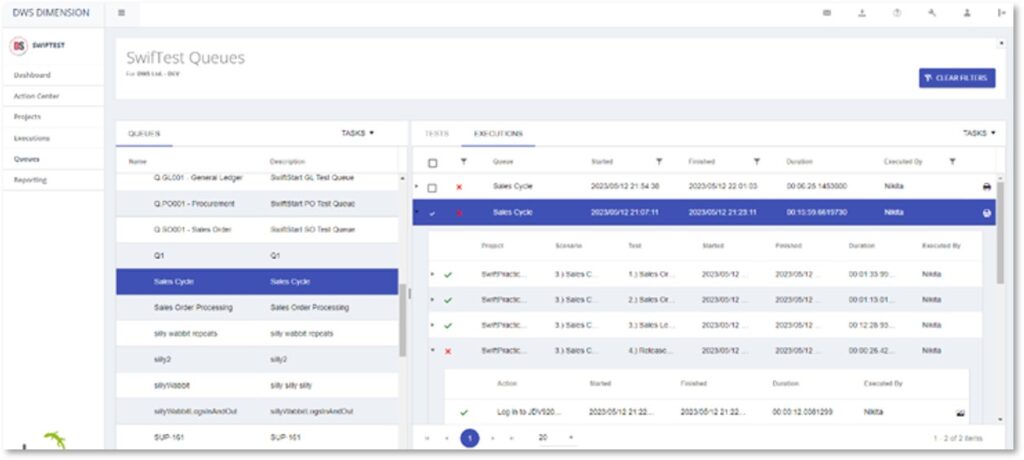
For the next use case, we are looking at when a test has failed within a queue.
Navigate to your queue and select executions. The first panel will show the amount of times the queue has been executed and the second panel will indicate the test within the queue that failed. When you select the test that has failed, you are able to navigate to the action that caused the failure of the queue.
Reporting
It’s important to have an accurate record of test results, whether they failed or succeeded. These reports can be used not only for showcasing tests , but also as training materials. For reporting, we will be logging into the Dimension Hub portal rather than the SwifTest client application.
In Dimension Hub there are many ways to view the execution history:
- Projects
- Executions
- Queues
- Reporting
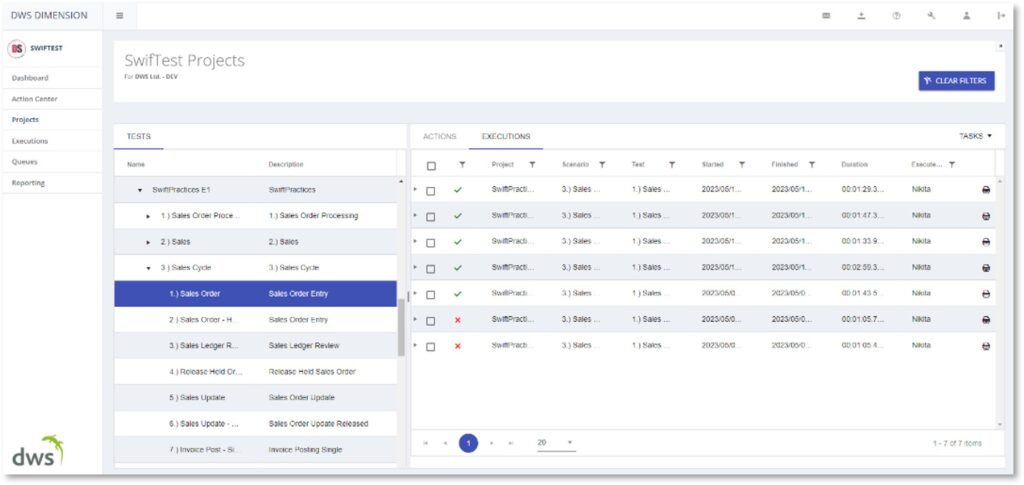
Projects
When selecting the projects tab, navigate to the specific project and test. Select executions and the executions will populate:
Executions
When selecting the executions tab, navigate to the specific project and test. Select the test and expand the arrow. All the actions will populate and it will showcase on which action the test has failed:
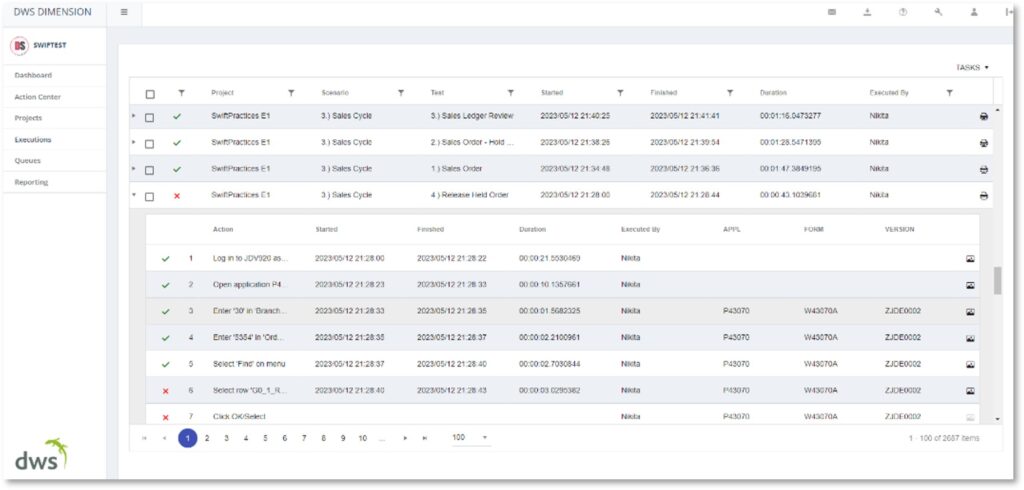
Queues
When selecting the queues tab, navigate to the specific queue. Select the test and expand the arrow. All the actions will populate, and it will showcase on which action the test has failed.
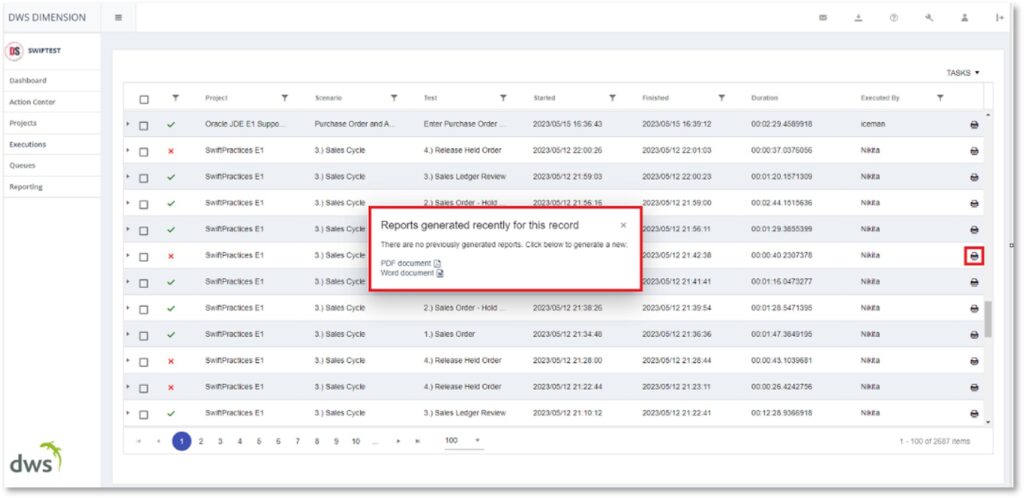
You will notice a print icon on all of these tabs. With this icon you are able to create the report. Created reports become available for download in the reporting tab.
When selecting the print icon, you will be prompted to select pdf or word.
Reporting
Here you are able to download the report.
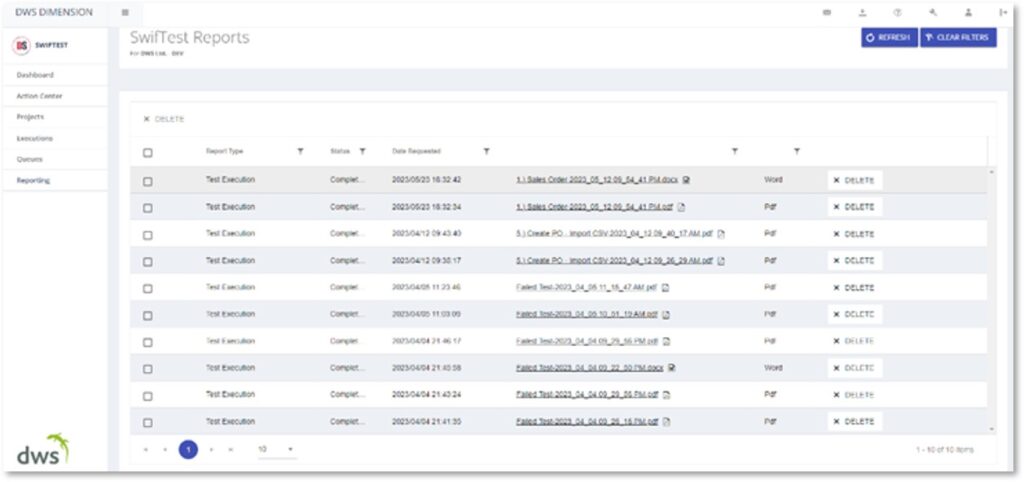
When the file has been downloaded, you may use the report for troubleshooting or training purposes.
If you have any quesions or feedback, please contact the helpdesk.